Wednesday, October 30, 2013

Accretionary Wedge 61 - What do I do as a sourcewater protection hydrologist?

This month's Accretionary Wedge #61 topic, hosted by GeoMika, is asking what exactly everyone does in the real world as a geoscientist. When students ask, "what can I do with this degree?", it's difficult to answer, because there are so many ways to be a geoscientist. For this month's post, we're answering that question with "well, you can do a lot of things - but this is what I do". So, I will tell you about what I do as a sourcewater protection hydrologist.

Specifically, I work for the State of Minnesota, tasked with protecting potable groundwater throughout the state. This is my first "real" career job out of school, so everything I've done is a new experience - especially figuring out which aspects of my education I actually use and which I don't. I'll point them out as I go. I have a basic undergraduate geology degree (obtained while in Minnesota), and a master's degree focusing on karst hydrology and GIS (from down in Missouri).

To summarize, my hydrological duties consist mostly of officework with a minor component of fieldwork. I will focus on the officework for this post.

My main ongoing task is performing and writing groundwater protection reports for the many small cities throughout the state. Each city that has a municipal drinking water system gets one of these reports every few years (to account for changing conditions or updated information) describing the flow of groundwater towards their wells. By knowing where the groundwater is flowing from, an area on the land surface can be drawn to protect the water they drink, called the wellhead protection area.

Illustration of a Wellhead Protection Area, showing where on the land surface recharges groundwater for a well.


This is accomplished through groundwater modeling. There are many types of methods and software to do this. As the saying goes in science, "all models are wrong, but some are more useful than others". To run these models, I need varying amounts of the following information: pumping rates of wells, aquifer properties (thickness, material, flow boundaries) and hydrologic properties (conductivity, water levels, flow gradient). In other words, data mining to start with followed by looking at all the important data to describe the local hydrology and geology. Luckily, our state has an extensive well GIS database, with each well providing important information, such as water level and stratigraphy from driller's logs.

There are over 260,000 wells in Minnesota's County Well Index, each with much useful information, such as aquifer type. No shortage of data here for the GIS-savvy.


One of the early steps is producing a basic groundwater flow field near the area I'm studying . Almost every geology student will perform something similar to this in a lab - usually hand contouring water levels on paper. The same principles apply here - groundwater flows from high to low water level elevations and perpendicular to the contours. A rough version of this can be created in ArcMap by selecting the nearby same-aquifer wells and then using the geostatistical tools on the recorded water levels. This requires a basic understanding of hydrology and handiness with ArcMap (definition queries, geostatistical tools, editing).


Local groundwater flow field produced from contouring well water elevations using geostatistical tools in ArcMap.

My favorite part of this process is describing the local geology through cross-sections from well logs and published materials. There is always plenty of information to start with - chances are good that either the well driller or the city already know what kind of aquifer they are drawing from (glacial sands, igneous bedrock, sedimentary bedrock, etc.), so I know which maps to refer to. One or two cross-sections are planned to best describe the subsurface.

Shaded bedrock map with cross-sections A and B. The line A-A' represents the cross-section below.

There is a lot of room for interpretation here, as well logs contain the information recorded while drilling the well, and drillers sometimes have their own unique vocabulary and varying attention to detail (from the supremely uninformative "rock" to redundant "clayey-clay"). It's also where you get to be artistic. A crude cross-section can be made from the well logs alone, but is better refined by then referring to any published geologic maps or shapefiles. Everything but the drawn geologic units below is quickly created using the GIS tools and well data available to us (the vertical lines are driller's logs with colors representing different units or rock/sediment types. It even puts in the elevation lines and topography - it's almost too easy!).

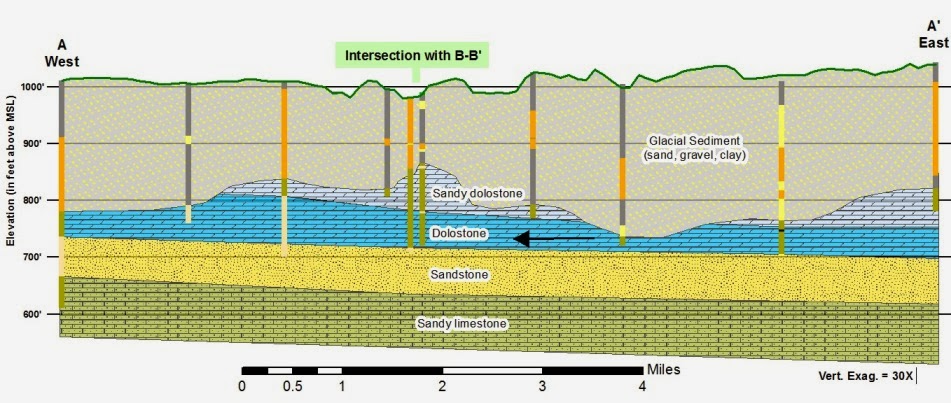
A geologic cross-section drawn from driller's logs. The aquifer used in this region is the combined dolostone (blue) and sandstone (yellow) units. Not the irregular bedrock topography due to glaciation and pre-glacial stream valleys.

By combining the flow field with the cross-sections, I get a basic understanding of the local hydrogeology. For this site, the wells draw from both of the dolostone units (light and dark blue) and the sandstone (yellow). Both units are buried under nearly 200 feet of Quaternary glacial sediment (which includes lots of clay), so the aquifer is well protected from rapid surface recharge - a good thing. I always like seeing the buried valleys in the bedrock - remnants of the last Ice Age. This requires handiness with ArcMap (again), basic stratigraphic principles, and some artistic and interpretive license (there is no standard to how these are made - some hydrologists settle for crude, choppy, black-and-white affairs. I take pride in my color schemes).

The fact that the well above draws from two types of sedimentary bedrock; a dolostone and a sandstone, is important, as groundwater flows differently in these different rock types. Water flows between the sand grains in the sandstone unit, while water flows through fractures in the dolostone. Both bedrock types require different modeling techniques, so more than one model is run for the well to account for this.

After identifying aquifer thickness, type, hydraulic conductivity (from pumping tests, or calculated in other ways), and pumping rates from wells, I can insert this information into one of many different groundwater modeling programs. These programs attempt to emulate the local flow conditions by incorporating the regional groundwater flow lines with gradients produced from pumping wells (like how a black hole warps gravity, drawing nearby things toward them).

A groundwater flow field model incorporating pumping information from nearby wells. Note how the wells warp the regional flow lines.

From there, I just specify which well I want to draw some flow pathlines to, and the travel time (say, 15 years). This will work backwards to show the extent of particle lines feeding that well for that amount of time (everything in that area will reach the well in 15 years).

Simple model of particle lines (purple) flowing to a well for a given time. Groundwater flow is from bottom left to top right.

The better I understand the local geology and hydrology, the better the resulting model. I had no real background in groundwater modeling before starting here, but most of these programs are easy to learn, though difficult to master. A willingness to learn is the basic requirement for this part of my job, although some knowledge of numerical hydrology will go a long way. The end result from this modeling is the Wellhead Protection Area (see illustration towards the top of the post) which is converted into a Drinking Water Source Management Area (see below, made by enclosing the Wellhead Protection Area in with notable surface features, such as roads or political boundaries). This information is available to the public, and you can even look up the groundwater protection area for your city here.

Drinking Water Supply Management Area for Mound, Minnesota. The aquifer is deemed Not Vulnerable based on water chemistry and geologic information.

In order to do what I do on a daily basis, I regularly rely on what I learned in hydrology, structural geology, stratigraphy, and GIS courses; some fairly basic coursework. Each of these reports is like a mini research project, so having performed an undergraduate project and a master's thesis is important. But aside from those points, I there was one class which have especially helped me be better at my job, while not being necessary to doing it.

One of the most useful geology classes I ever took was one of my first. It was called Minnesota's Rocks and Waters - a geology class for non-majors. I took it along with the Introductory to Geology class, just as a filler. It was one of those large classes that people took to get a science credit. It was a fairly in-depth look at all of Minnesota's unique geological regions, and what got me inspired to pursue geology as a career.

Despite being a low level class, it laid down a foundation which allowed me to have a head start on all of the geology trips I would go on throughout the state. It woke me up to the world of geology by making it local - to learn about why there are igneous and metamorphic rocks here, or why there are sandstones and limestones there, and why there are rolling hills of glacial clay and sand throughout most of the state - information I still use today. Whenever I start a new groundwater protection report in another part of the state, I get to remember what I learned in that first class years ago, and why I fell in love with geology. It didn't introduce me to any advanced geologic topics, but it was informative, and I get to use that information daily, which makes it useful. I always keep the text from that class nearby.

Sunday, June 30, 2013

Missing Record


Once in a while, I run across some super useful geological figure or diagram. I ran across this little gem while perusing through a report on the Paleozoic rocks of Minnesota.
Now, I have strat columns of the Minnesota hanging around, but this isn't a traditional strat column (it's much cooler, oh yes). It shows a number of things which a regular strat column doesn't.

A strat column will show the names, vertical positions/thicknesses, and symbology of each geologic unit. So does this diagram. Where they are differing, though, is that the vertical axis on a strat column is "thickness" while the vertical axis on this diagram is "time".

The first fun thing to point out is that they don't mean the same thing. These are all sedimentary rocks, yes, which take time to deposit, I know, so thicker rock units obviously took more time to form, right? Well, not exactly. One rock unit which formed from rapid deposition over a short period of time may end up being the same thickness as one that formed from slow deposition over a long time. Geology is tricky like that sometimes.

A convenient example of that last point is seen by comparing the Jordan Sandstone and Oneota Dolomite (at the Cambrian/Ordovician boundary). They're almost the same thickness in many places (the Jordan is slightly thinner at about 100 feet, compared to the Oneota's 125-150 feet). But in terms of time of deposition (based on the diagram) the Jordan Sandstone formed more rapidly; only about a million years, compared to the Oneota's five million years. Just doing basic math (forgive me for oversimplifying sedimentation), that means the deposition rates are something like:

Jordan Sandstone -  70-100 feet per million years

Oneota Dolomite -  25-30 feet per million years

Getting to the basics of what these rock types are, this relationship makes perfect sense to me. The Oneota is a carbonate rock formed from marine organisms in gentle, shallow, offshore environments (like the Caribbean). Deposition would be slow, but fairly constant. Carbonates need some pretty hospitable conditions to form, so rates are easily affected if the right conditions aren't met. As for the Jordan Sandstone, formed by the deposition of sand in a near-shore environment (like a beach) by sediment grains being washed in from the highlands, the conditions don't need to be friendly. In fact, the Jordan Sandstone tends to have some fairly thick and pronounced cross-bedding, indicating some large tidal events or storms. Although deposition would not be constant, when it happened, it would be in fairly large bursts.

The second thing I like to notice is how much of time has no rock record (the gaps between rock units). These represent periods of time in which either 1) deposition and rock formation didn't occur, or 2) deposition and rock formation occurred but was then eroded away. This happens when sea level drops and the rocks are exposed to weathering and erosion.

Another thing which finally made a lot of sense upon seeing this diagram (which I wish I could have seen in Sedimentology/Stratigraphy class) were the Cratonic Sequences (or Sloss Sequences) on the right side of the diagram (the Sauk, Tippecanoe, etc), about episodes of deposition and erosion of the Paleozoic rock units in North America. My professor would just show us this eye-sore of a diagram and go "get it?" and we'd go "no". But when I saw this diagram, I saw (because of the vertical axis being time) the "groups" of sedimentary rock units separated by the gaps with no rock record:

1. The seas rise, flooding the continent. The first units to form are formed from eroding the basement rock, making them clastic and sandy (the Mt. Simon (which I've talked about)/Honckley/Fon du Lac Sandstones). Seas rise, shoreline progresses inland, water gets deeper, and then the shaley units form (Eau Claire/Franconia/St. Lawrence Formations). More sea level rise, and finally you get the carbonates (Oneota Dolomite/Shakopee Formation). This is a typical transgressive sequence, something you learn as a first year geology student. More specifically, this is the Sauk Sequence in Minnesota.

2. The seas recede and expose the previously deposited rocks to erosion. These can be short-lived recessions (like between the Oneota Dolomite and Jordan Sandstone) or large (between Sloss Sequences).

3. The seas advance again; first forming the clastic rocks (St. Peter Sandstone) then grading upward through the shaley units (Glenwood Shale, Decorah Shale) and into the carbonates (separately indicated on the diagram, but overall referred to as the Galena Group). This is the Tippecanoe Sequence.

4. Seas recede again for a while, and when they advance again, deposit the Kaskaskia Sequence (which only occurs in a small part of southern Minnesota, so I've never seen it in any well logs yet).

All these sea advances and recessions occurred in Minnesota in what is called the Hollandale Embayment - a depression which allowed the sea to advance "upward" into the otherwise highland of the area. Since Minnesota was fairly high above sea level at the time, only the largest sea advances "reached" us, making the Paleozoic rocks here generally thin and representing short periods of time. This is opposed to, say, Missouri, which was closer to the edge of the continent and therefore developed a much thicker and more complete sequence of sedimentary rocks (while Minnesota's sed-rocks end in the Devonian, Missouri has another 70 million years worth of rock on top spanning through the Mississippian and Pennsylvanian periods, including the 4th Sloss Sequence, the Absaroka Sequence, which is absent in Minnesota). The strat columns of these two states therefore share equivalent rock units at some places; sometimes with the same name (St. Peter Sandstone, Glenwood Shale), sometimes with different names but stratigraphically the same (Mt. Simon Sandstone in MN = Lamotte Sandstone in MO). But Missouri contains many sedimentary rocks that have no Minnesota equivalent, since sea level advances reached Missouri much easier, and stayed longer.

The last thing I wanted to talk about which related to what I do for work is in regards to the gap between the Oneota Dolomite and Shakopee Formation. For almost all purposes, these two units are usually just grouped together into what is called the Prairie du Chien Group - both because they look so similar in well logs, but also because there's "usually" no sense dividing them as they tend to behave as one hydrogeologic unit. But we have observed an exception - during that gap between the units, the Oneota Dolomite was exposed to the land surface, resulting in karst formation, which was then advanced over to form the Shakopee Formation. When we've looked at this boundary in downhole camera video and depth-specific sampling, we can see this paleokarst boundary as small caverns and sand. This boundary acts as a groundwater conduit which we've seen increased water flow and even different water chemistry.

Thursday, May 2, 2013

Cancun Trip - Cenote Snorkeling

My family recently went on a trip to Mexico – more specifically, Cancun, in the Yucatan peninsula.


We went back to a resort we had gone to two years ago for my brother’s wedding, and had liked it so much, we decided to go back. Although I enjoy the whole sun and relaxation thing, ever since I discovered the world of geology (pun!), every new place I visit I appreciate the “place” as much as the “vacation” (Oh god, I sound like a geographer…).


Trips to tropical seas are always interesting for geologists, especially those that ever studied limestone (limeston forms in shallow tropical seas). I went to graduate school at Missouri State, and my research focused on local rocks, which was basically…

Missouri geology

Limestone is the dominant rock type around where we stayed in Mexico. The difference between the limestone in Mexico and the limestone I’ve usually looked at is the age:

Cancun limestone – 2-24 million years old (after the dinosaurs, mammals/humans evolving)

Missouri limestone (Burlington Limestone) – 350 million years old (pre-dinosaurs, ocean life dominant)

Minnesota limestone (Prairie du Chien Group) – 480 milion years old (first fish evolving, trilobites everywhere)

Geologically, the limestone around Cancun is very young. The environment in which the limestone formed is not much different than the local environment there now. This is not the case for Missouri and Minnesota, which are (unfortunately) no longer home to shallow tropical seas. It’s always fun to connect the locations together geologically, separated by time; Missouri and Minnesota used to look like Cancun, and someday Cancun may be hundreds of feet above sea level with hobbit-like Midwest weather (which I got to escape from for a week).

What about Maysies? Thundersnow? June frost?

Although we could have contentedly never ventured out of our all-inclusive resort, some of us wanted to go exploring. Our options were to check out the Mayan ruins of Tulum, or do some snorkeling. The snorkeling involved two parts – in the ocean, and in some caves. I was sold on the cave snorkeling. Besides, I figured I could come back and see the Mayan ruins some other day, unless the world ends in 2012 (awkward).

Cenotes are collapse sinkholes which are filled with groundwater. Sinkholes typically come in two flavors: 1) “Slump” sinkholes, or soil depressions formed from soil being siphoned into an underground passageway (think of the dimple that forms in the sand of an hourglass), or 2) “Collapse” sinkholes, an open hole that forms as the roof of a near-surface cave suddenly collapses (this is the type that's been in the news a lot lately, attacking people while they sleep). Since the cave can form deep underground and slowly grow closer towards the surface, when it does finally collapse, it will suddenly reveal a large open cavern. Often, these caverns are connected to other caves or cenotes through smaller passageways. Knowing this, you can’t help but look at all the solid rock around you and realize it’s all basically Swiss cheeserock.

After snorkeling with some turtles in the ocean, we headed to the cenotes, involving a little walk through the jungle. One thing our tour guide talked about which I really liked was that of the motmot bird, named for its distinct call. While walking on a trail to one of the cenotes, we saw a motmot flying between the trees ahead of us. These birds are known to specifically hang around cenotes. When the Maya would travel through the jungle, they could listen for the motmot’s call to guide them to a source of water.

The cenote first appears to be a small pond randomly in the middle of the jungle.

First glimpse of the cenote from the trail

A view of a cave passage near the edge of the cenote

A view from within the cenote
Once we got into the water (which was MUCH colder than the ocean), we began to explore, and on one side of the pond, went into a cave system. Although we were very close to the ocean, the water here is freshwater, although in some places you can get the freshwater mixing with saltwater. We also encountered a few scuba divers while we were snorkeling around - there was plenty of cave passage for them to go into.

First look into the cave passage. The water is much deeper than it looks

Underwater shot in the cenote cave

Diving to the bottom

Exploring the edge - I couldn't see where the cave went
We also encountered this tree…well, the roots of it, actually…while in one of the cave passages. At first I thought they were some kind of strange speleothem, but getting closer we saw they were tree roots. Each root came down through the cave ceiling in what looked to be a perfectly sized hole for each root. I had known that roots can pry rocks apart, but these didn’t always look that way. We were told by the tour guide that the roots release a type of enzyme which dissolves the limestone away. By doing this, the roots can grow downward and reach a source of water.

Within a dry section of one cenote. Note the tree roots growing from the cave ceiling to the floor.

Roots growing down from the cave ceiling into the water

Sunday, February 17, 2013

Old Rocks, Cold Rocks: Mid-winter Outcrop of the Mt. Simon Sandstone

A good friend of mine has been working on a research project to better define the stratigraphy of the Rock Elm Crater in west-central Wisconsin, a crater the result of an Ordovician-aged meteor impact. A characteristic of meteor impacts is a "rebound" of the underlying material, forming a central peak.


Due to extensive erosion that has occurred in the Upper-midwest since the Ordovician (especially recent glaciation), these features are topographically obscurred. Recently, though, a sandstone unit was found where the central peak would have been. Due to the suspected age of the impact, and the local stratigraphy, it's likely the central peak is composed of the Cambrian Mt. Simon Sandstone, a medium- to coarse-grained, poorly to moderately sorted, pebbly, white-to-gray, quartz sandstone, which tends to be cross-bedded towards the top.

My friend was then tasked with comparing this sandstone in the crater to exposures of the Mt. Simon Sandstone elsewhere. Being the basal sedimentary unit throughout the Midwest, buried under hundreds of feet of sedimetary rocks, glacial sediment, or both, outcrops are limited. With the help of a road guide, though, we took a day to go explore some outcrop in Chippewa Falls, Wisconsin, near the rock unit's northern extent (The Mt. Simon Sandstone is named after a hill in Eau Claire, Wisconsin).


I jumped at the opportunity to see a rock unit which I'd never seen in outcrop before, although I've come across it many times in other ways. During my early undergrad geology years, I had learned about the Mt. Simon being an important local aquifer, since it's the lowest stratigraphic sedimentary unit around. I also learned that its recharge area is around Eau Claire, Wisconsin (right next to Chippewa Falls), which makes sense considering it outcrops around there. I started working as a hydrologist for the state a few months ago, and I've already had to model groundwater flow through the Mt. Simon, so I've seen it before...in well records, usually a few hundred feet down. Most of my work has been along its north-western edge (in south-central Minnesota), the edge of the Hollandale Embayment, which the Minnesota DNR recently finished a report on to better define the western edge.

I've seen the Mt. Simon's stratigraphic equivalent during graduate school in Missouri - the Lamotte Sandstone. The Lamotte outcrops around the St. Francois Mountains (which I've described in a previous post). Around Springfield, where I went to school, it was fairly deep (I don't recall the exact depth, but must have been close to 2000 feet below surface). It's not used as an aquifer in that area - it's too deep to be practical, so there are aquifers above it to use, and it tends to be saline. A few friends of mine did their graduate research on an ongoing study to use the Lamotte Sandstone as a carbon sequestration reservoir.

This trip took us to Irvine Park, where the Mt. Simon Sandstone is exposed along the banks of Duncan Creek. The outcrops were surprisingly easy to access, being just off of the footpath that crosses the creek.  We did have to trudge through some snow, but it is February, and this is Wisconsin.

The first thing we did was ignore the signs.


Gasp!


In the name of science!


Crossing the half-frozen Duncan Creek.

The most noticeable feature of the sandstone, even from a distance, was the cross-bedding. Cross-beds are structures formed from sediments being deposited at an incline; either underwater from ripples and wave action, or on dry land as dunes. A group of inclined layers is called a "set". This is one of those few cases in geology where the apparent tilting of beds isn't the result of the beds being deformed - they were deposited at that angle. The boundary between the sets is nearly horizontal. The sets here ranged from a few inches to a few feet thick.


Diligent note-taking.


Examining a cross-bed set in the Mt. Simon Sandstone. The direction of flow for the bottom set is to the right (southeast).
Cross-bedding is useful because it gives an indication of both the direction and intensity of flow when the sand was deposited. This all translates to an understanding of the environment in which it formed.


Up close the cross-beds alternated white to orange and were about 1 centimeter thick.


Cross-bedding in the Mt. Simon Sandstone. Hand indicates the orientation of the set.

Same as above, but hand now indicating the orientation of the cross-strata within the set.

Pointing out orientation of the sets and the cross-strata. Almost all of the cross-sets indicate flow direction was to the right.


My friend noticed that the orange layers tended to be coarser than the lighter layers.


Alternating finer-grained/white and coarser-grained/orange layers within the Mt. Simon Sandstone.


When one set deposits over another, it truncates the bottom set's cross-strata, forming a discrete horizontal contact which highlights the cross-strata.

As we went along we came across an area where the grain sizes became more divided between either fine or coarse grained. The fine grained sand appeared lighter, while the coarse grains were darker and mixed.


Contact in the Mt. Simon Sandstone between fine-grained layer (top) and a coarse/pebbly layer (bottom).

Wavey bedding in the Mt. Simon Sandstone. Some layers were fine-grained, while thers were pebbly. Cross-bedding was less obvious.

Pebbles stuck out on the weathered surfaces.

This location provided a pretty good way to check out some textural variation in the Mt. Simon, and provided some great examples of cross-bedding. The literature description of this rock unit matched what we saw - a fine- to pebbly, cross-bedded sandstone. These tended to look fairly similar to some exposures of the Lamotte Sandstone I remember seeing in Missouri. Hopefully this provides some useful information for determining the stratigraphy in the Rock Elm Crater.

We also saw a frozen waterfall!